Download a PDF overview of the Synaxis Macroscope Marketing and Sales Intelligence Tool.
Challenge
A properly executed marketing or sales project seeks to improve the performance of your marketing and sales functions. Before you start a project, you need to be able to view and benchmark the processes. Otherwise, you won’t be able to measure your success. Modeling and measuring your marketing and sales functions and tools can be your biggest challenge.
Solution and Benefits
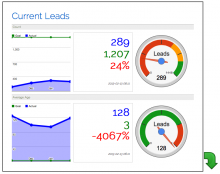
 Generation of revenue is the most important end goal of all marketing and sales functions and tools. The Macroscope Marketing Dashboard provides a systematic view of what activities and tools contribute to revenue and in what proportions. Synaxis Macroscope™ provides a comprehensive view of your entire marketing and sales pipeline. This allows you to establish benchmarks and track the progress of your strategic and tactical marketing and sales initiatives and projects. Beyond the ability to measure and track your marketing and sales metrics, Macroscope allows you to identify weaknesses in your pipeline. In addition, it offers business case analysis of potential projects by modeling “what if” scenarios.
Approach
 Implementing a Macroscope Marketing Dashboard involves 3 steps:
- Modeling the pipeline to reflect the activities and tools that are operational
- Benchmarking each marketing and sales activity and tool
- Building scenarios to model changes and establish goals, budgets, and ROI targets
Based on years of experience with companies from many industries, including academic organizations and non-profits, we have developed a completely general pipeline system. This system is adaptable to any organization. Such an interpretation identifies the key performance indicators (KPIs) that will be tracked for your individual marketing and sales pipeline. Armed with our scenarios, you can make an informed and realistic decision about which marketing and sales projects to undertake.
Benchmarking
 Once the basic model has been established, we will implement a system to gather data. This usually takes place over 3 months, in order to give a good sample of data. During this time, we implement manual or automated data gathering systems. For organizations with the appropriate technology (usually this means your tools have an API), we can establish a data warehouse and maintain a separate database of KPI-related data from various systems. In addition, we will start to display this data on Synaxis Macroscope™ so you can visualize how the numbers are evolving.
Download a PDF overview of the Synaxis Macroscope Marketing and Sales Intelligence Tool.
